The Analytics dashboard provides a full overview of briefs data.
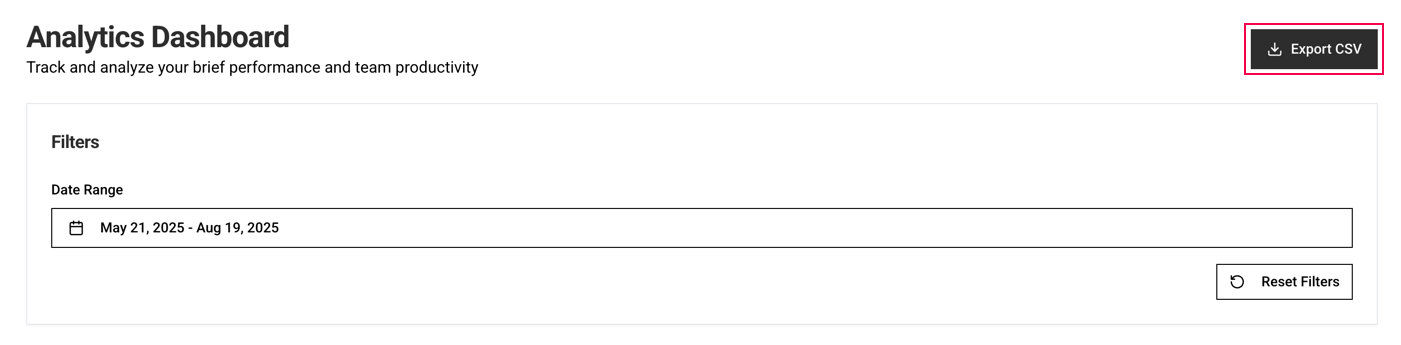
Start by setting the Date Range filter (it will remember the first date and insert todays date as the last date automatically).

KPI boxes
You can click on the individual KPI boxes to get more details.

All Briefs
All Briefs shows a list of all briefs within the Date Range.

Export CSV
All brief data can be downloaded as a CSV file.
Dashboard Charts
The charts provides visual overview of Brief Volume Trends, Briefs by Collection, Briefs by Category and User Productivity.

Was this article helpful?
That’s Great!
Thank you for your feedback
Sorry! We couldn't be helpful
Thank you for your feedback
Feedback sent
We appreciate your effort and will try to fix the article